Interactive Visualization Interface Generation for SQL Analysis in Notebook
Video
Team Information
Team Members
Jeffrey Tao, MS Student in Computer Science, Columbia Engineering
Yiru Chen, PhD Student in Computer Science, Columbia Engineering
Miles Hong, MS Student in Computer Science, Columbia Engineering
Faculty Advisor: Eugene Wu, Associate Professor of Computer Science, Columbia Engineering
Abstract
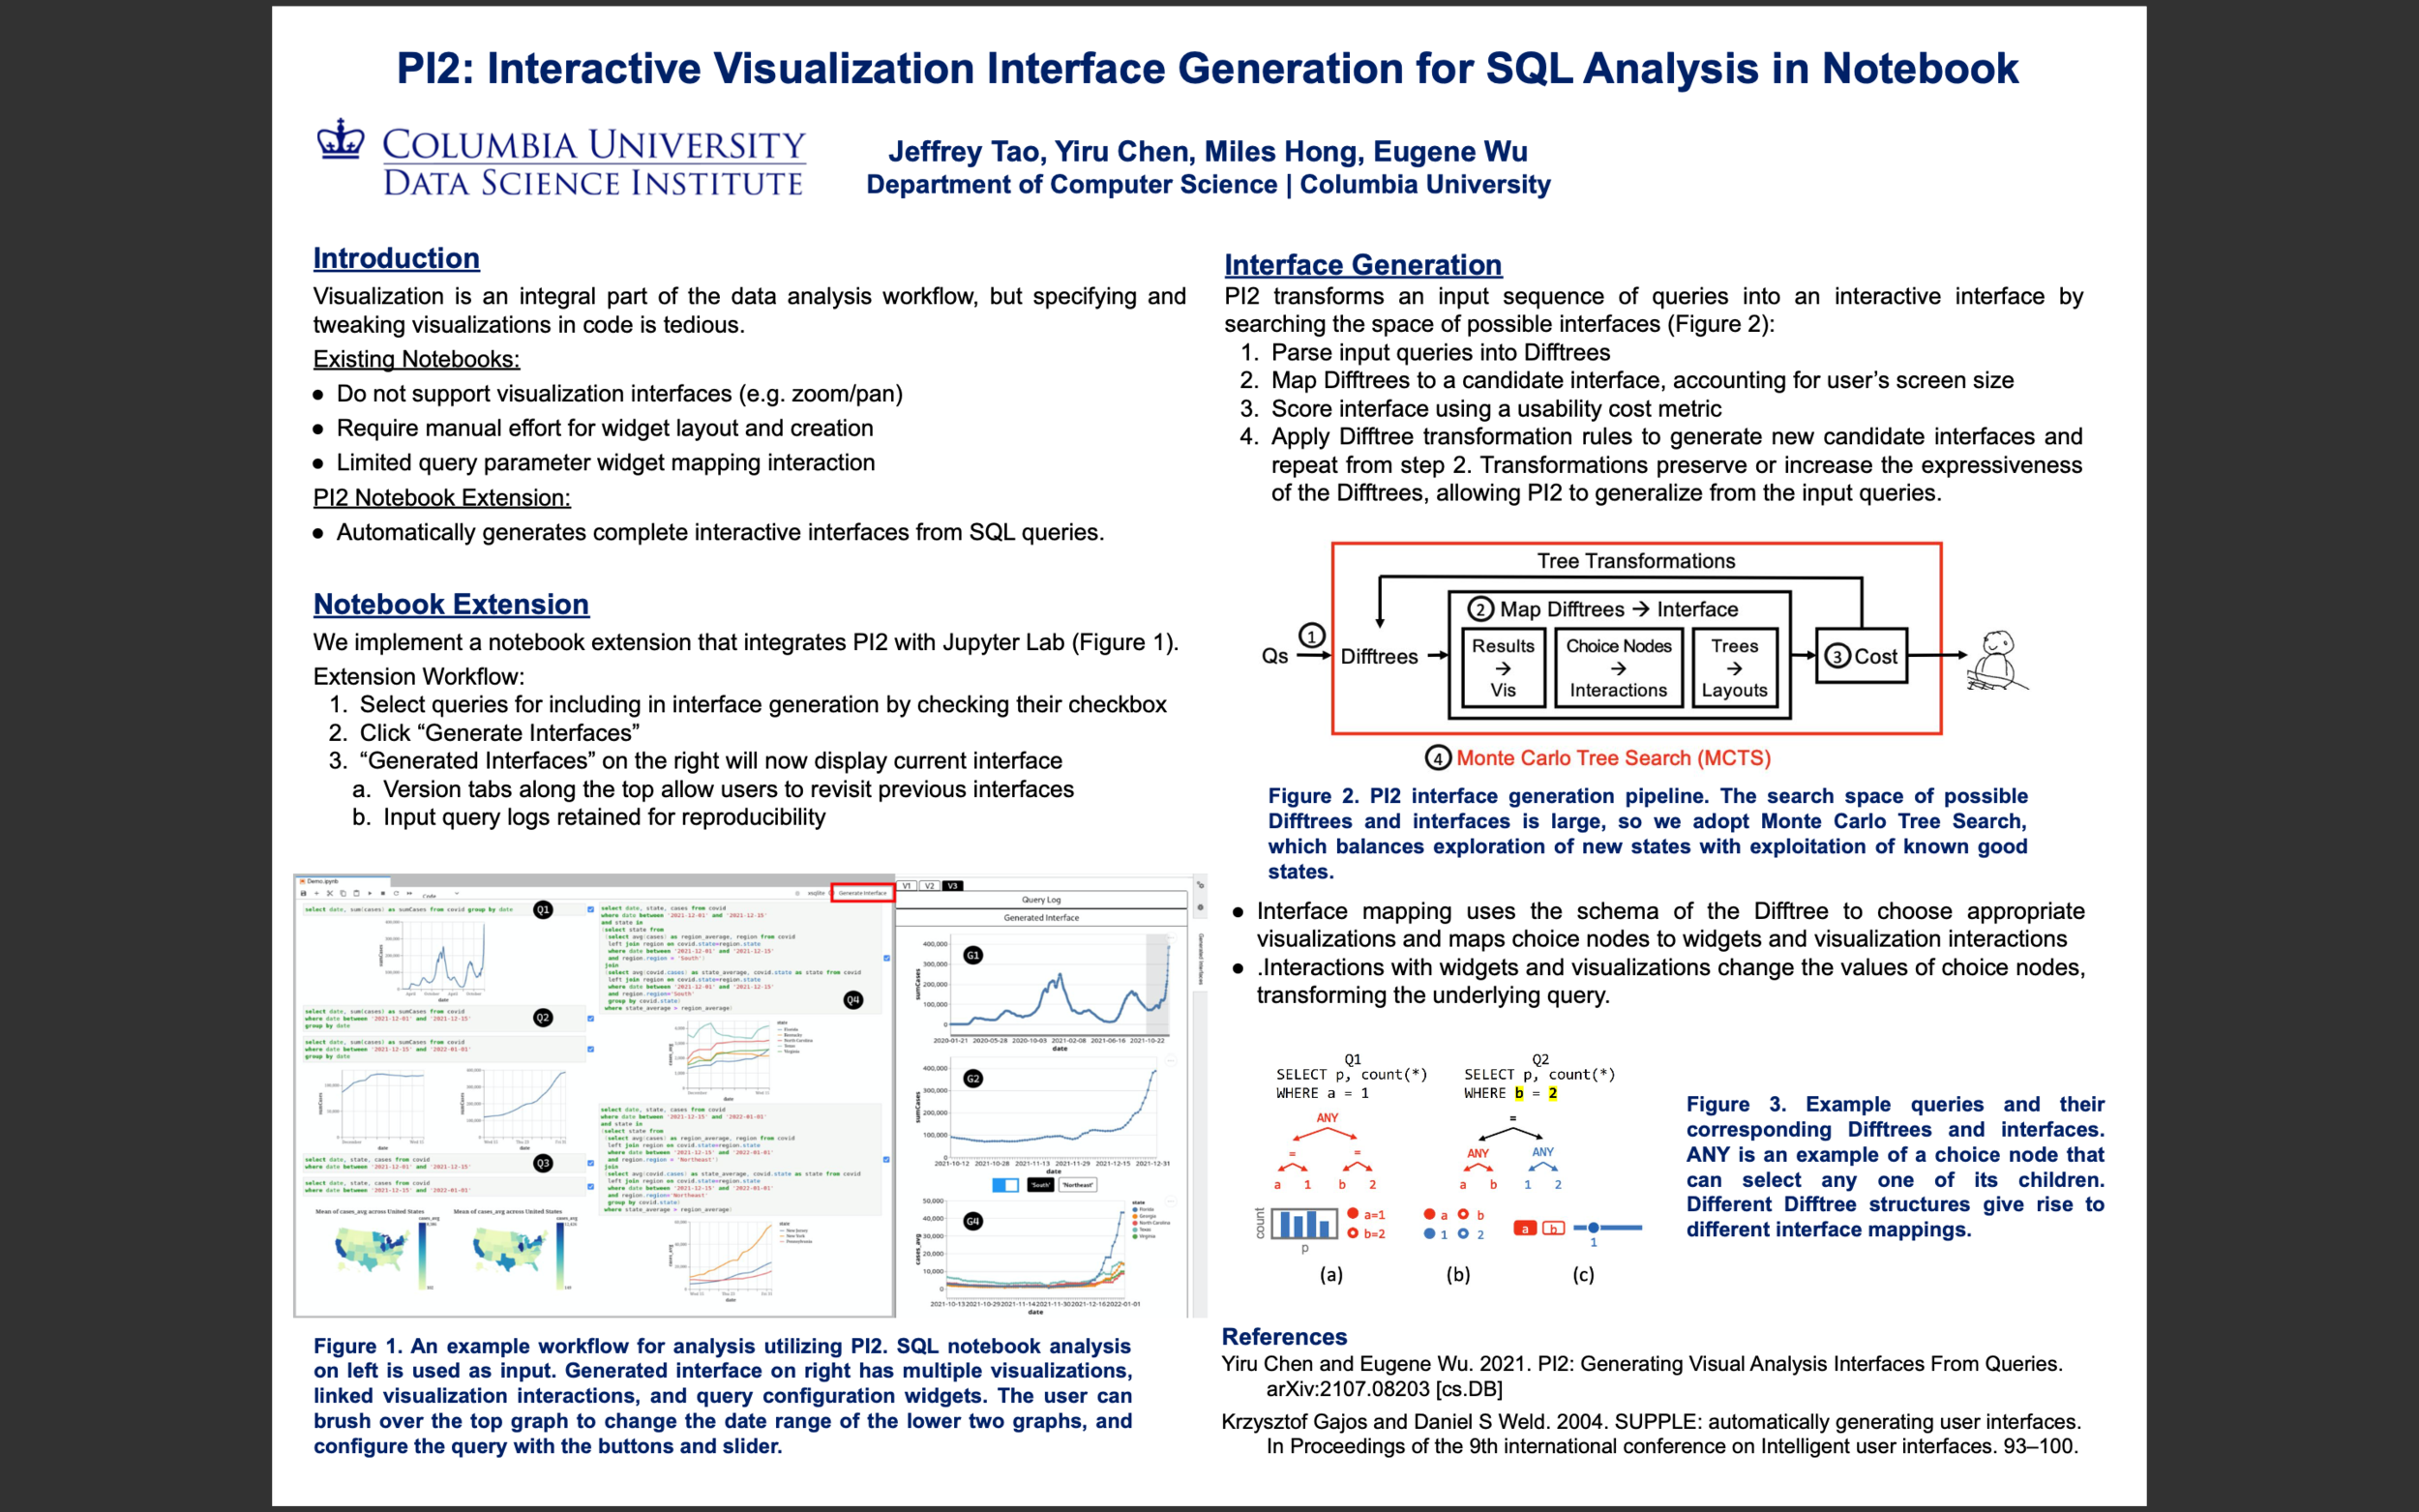
Existing notebooks for interactive visual analysis interfaces have limited support for interactivity, do not support generating interactive visualizations, and require manual effort to create and lay out visualizations and widgets. We demonstrate PI2, the first notebook extension that can automatically generate interactive visualization interfaces during SQL-based analyses. PI2 analyzes queries syntactically and represents a set of queries using a novel Difftree structure that encodes systematic variations between query abstract syntax trees. PI2 then maps each Difftree to a visualization that renders its results, the variations in each Difftree to interactions, and generates a screen-size-appropriate layout for the interface.
Team Lead Contact
Jeffrey Tao: jat2164@columbia.edu